
Careless Responding in Surveys: A Threat to High-Quality Data
September 23, 2022 in Keeping Up with Human Capital
By Nathaniel (Nate) Voss

Leveraging high-quality data is essential for organizations to thrive in the modern world. Indeed, the costs of poor quality data can be devastating. For example, according to an estimate by Gartner, low-quality data can cost organizations around $15 million per year. Additionally, a 2016 IBM study estimates that low-quality data costs the U.S. economy around $3.1 trillion annually. In line with these statistics is a 2018 KPMG Global CEO Outlook Study that found 56% of CEOs have concerns about the integrity of data that informs their decision making. While many kinds of data exist, survey data in particular remains extremely valuable for organizations. Given the critical role of surveys, relying on low-quality survey data for decision making can greatly hinder organizational effectiveness.
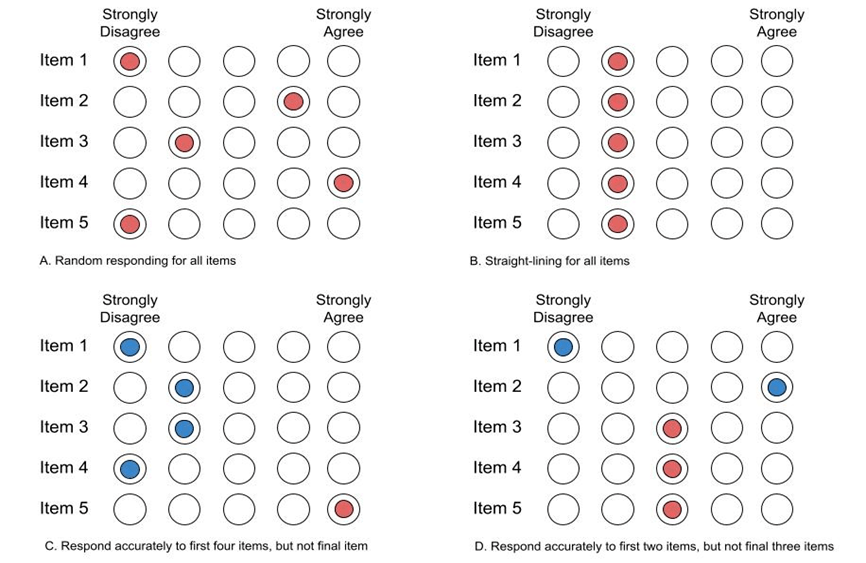
In an ideal world, everyone who completes surveys would do so accurately. Unfortunately, this is not the case. One of the major culprits of low-quality survey data is careless responding. Careless responding occurs when people complete surveys in a random, inattentive, and/or haphazard way such that their responses are not accurate. What might these response patterns look like? Consider the various scenarios shown in Figure 1. The top left (A) shows a response pattern where someone randomly responds to all items. The top right (B) shows a response pattern where someone selects the same response option five times in a row. The bottom left (C) shows a response pattern where someone starts off responding accurately, but then for some reason (perhaps they got distracted by an email), responds carelessly to the final item. The bottom right example (D) shows someone who responds to the first two items accurately but carelessly to the final three. As these examples illustrate, careless responding can take many forms and people can switch between careful/careless responding.
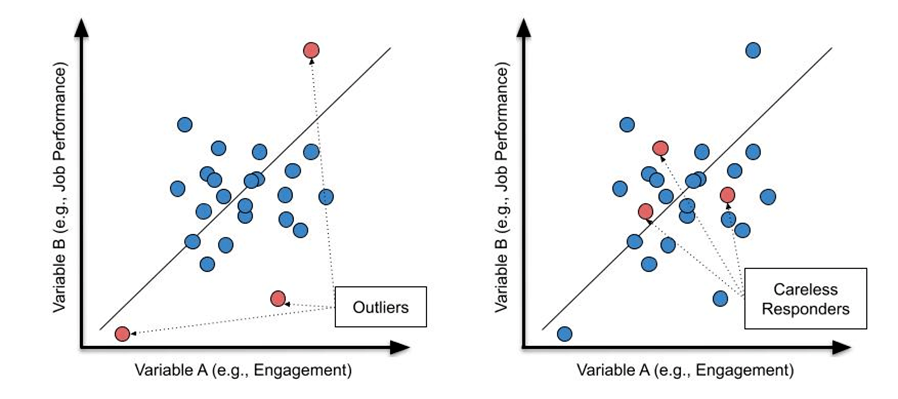
While careless responding is sometimes easy to spot – such as someone who selects the same response option across an entire survey – this is not always the case. One of the reasons careless responding can be so problematic is because careless responders often look like “normal” (i.e., accurate) responders and may not appear to be outliers. Consider Figure 2 which compares traditional outliers to careless responding. Outliers are datapoints that notably differ from most datapoints in a dataset (those marked in red on the left side of Figure 2). Careless responders, however, are not necessarily outliers (those marked in red on the right side of Figure 2), which can make them much tricker to spot and address.
Business Impact of Careless Responding
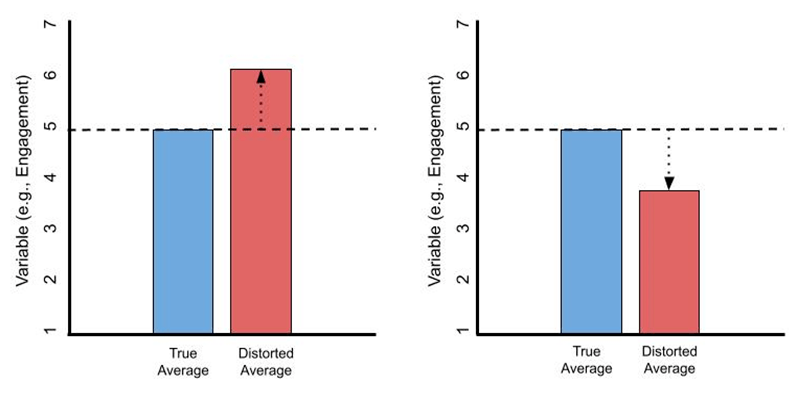
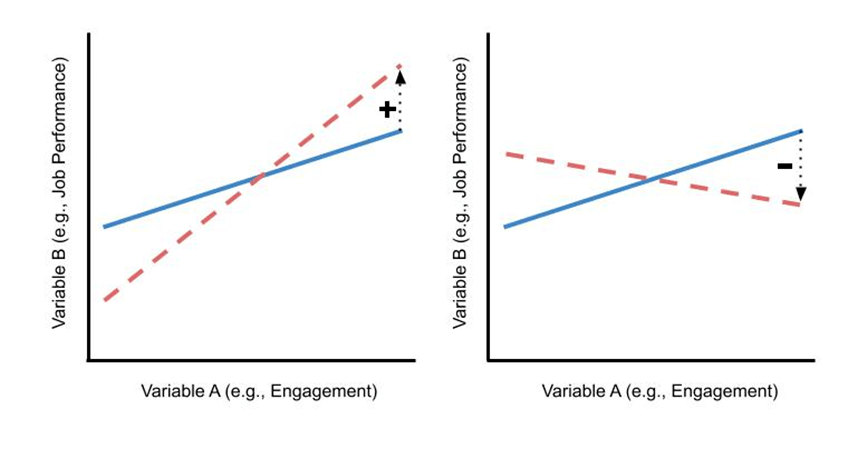
There are many ways careless responding can distort survey data. For example, consider the two scenarios shown in Figure 3 for how careless responding could affect the results of an item that measures employee engagement. In the first scenario (left), the presence of careless responding is artificially increasing the average engagement value (perhaps some people responded carelessly at the high point of the item’s scale). In the second scenario (right), careless responding is artificially decreasing the average engagement value (perhaps some people responded randomly, which would pull the true average down slightly). Research shows careless responding can also distort the relationship between variables in some situations. For instance, the first scenario in Figure 4 (left) shows how the presence of careless responding can artificially increase the relationship between variables (engagement and job performance in this example) and the second scenario (right) shows how careless responding can artificially decrease the relationship between these two variables. While these are just some examples of how careless responding can distort results, the effects of careless responding on data quality are almost always negative and ensure results are inaccurate to some degree.
Where things start to get problematic is when decisions are made based on low-quality survey data that is contaminated with careless responding. As noted at the beginning of this blog, making decisions based on low-quality data can be very costly. Ensuring high-quality data becomes increasingly important as organizational decisions become more expensive and/or time-consuming, as the consequences of making a poor decision in this situation can be detrimental. For example, consider an organization that spends a lot of money investing in ways to improve low engagement when this “low” engagement score is actually being driven by careless responding. Or, consider an organization that decides to invest in a new performance management system due to observing a low engagement-performance relationship when this “low” relationship is again due to careless responding. Even if surveys are used simply for tracking purposes (e.g., pulse surveys that monitor employee sentiment over time), the presence of careless responding can still have negative consequences. For example, this can cause leaders to have an incorrect understanding of key aspects of their workforce. Given this, accounting for and addressing careless responding is crucial for organizations to fully leverage the power of data.
How to Address Careless Responding
Fortunately, there are a variety of steps survey administrators, leaders, and organizations can take to reduce the threat of careless responding. For instance, some of the negative effects of careless responding can be reduced simply by following principles of good survey design. This may include writing appropriate items (e.g., ones that are relevant and only assess one thing), assuring response confidentiality, being clear how results will be used, and using shorter surveys where possible. Although not always effective, research shows that specific instructions to encourage high quality data can sometimes reduce careless responding. Various statistical techniques can also be used to help detect careless responding after data is collected. It can also be helpful to “know your audience” when determining if careless responding is likely to be a cause for concern. For example, research shows that people who score high on conscientiousness – a personality trait that entails being organized, careful, diligent, and detail-oriented – are less likely to engage in careless responding.
In conclusion, having high-quality data is crucial for organizations to be successful. Unfortunately, people do not always respond accurately to surveys, and this can greatly undermine data quality. For organizations to fully leverage the power of data, it is crucial to first ensure that data is of high quality, and if it isn’t, take steps to address this. While data-driven decisions have become the norm, the most successful organizations will be those that make such decisions based on high-quality data.

Nathaniel (Nate) Voss is a Senior Human Capital Consultant at FMP Consulting. He received his Ph.D. in Industrial/Organizational Psychology from Kansas State University. Some of his favorite project topics and areas of expertise include competency modeling, data analytics, and survey methods. When he is not nerding out about one of these topics, Nate enjoys eating out at new restaurants and playing games with friends.